NetDiag Response Schema Explained: DNS, TLS, HTTP & Ping Checks
Complete guide to NetDiag's JSON response schema. Learn what each field means, typical values, and how to troubleshoot common issues.
Network debugging often feels like searching for a needle in a haystack - especially when issues only happen in specific regions or under certain conditions. NetDiag aims to simplify this by providing a comprehensive JSON response from multiple global probes in one go. In this post, we'll dissect a sample NetDiag response schema field by field. For each field, we'll explain what it means, how it's produced, why it matters for diagnostics, typical values (using our sample), common failure scenarios, and troubleshooting tips. Along the way, we'll also peek under the hood at how NetDiag's multi-region architecture (coordinator and probes) works to gather these results in parallel.
To ground the discussion, here's a sample response from a NetDiag health check on aws.amazon.com:
{
  "runId": "a82ec2fe-ec08-4b2f-85d9-12d8b0830675",
  "host": "aws.amazon.com",
  "status": "Healthy",
  "quorum": { "required": 2, "total": 3, "met": true },
  "dnsPropagationStatus": "mismatched",
  "startedAt": "2026-01-01T04:03:58.3765584Z",
  "completedAt": "2026-01-01T04:03:59.6202816Z",
  "regions": [
    {
      "region": "ap-southeast",
      "status": "Healthy",
      "ping": { "avgRttMs": 1, "status": "Healthy", "tcpFallbackUsed": false },
      "dns": { "resolvedAddresses": ["108.156.144.30", "108.156.144.61", "..."], "status": "Healthy" },
      "tls": { "certificateValid": true, "expiresAt": "2026-10-17T23:59:59+00:00", "issuer": "Amazon RSA 2048 M04" },
      "http": { "statusCode": 200, "totalTimeMs": 325 }
    },
    { "...": "Other region entries follow" }
  ]
}
Don't worry if you don't recognize all these fields yet - we'll examine each in detail below.
Table of Contents
- Run Identification and Status Fields —
runId,host,status,quorum - DNS Propagation Status — Global DNS consistency check
- Timing Fields —
startedAt,completedAt - The
regionsArray — Per-region breakdown- Ping Check — ICMP/TCP latency
- DNS Check — Resolved addresses
- TLS Check — Certificate validation
- HTTP Check — Status codes & response time
- Architecture and Multi-Region Operation
- Conclusion
Run Identification and Status Fields (runId, host, status, quorum)
runId
This is a unique identifier (usually a GUID/UUID) for the diagnostic run. It's generated by the NetDiag coordinator when the request is received. The runId allows both the service and developers to trace or reference a specific run. For example, if you need to contact support or look up logs, providing the runId is helpful. In our sample, runId is a GUID like "a82ec2fe-ec08-4b2f-85d9-12d8b0830675". This field is always present on success - if you ever don't see a runId in the response, it likely means the request never fully initialized (which is rare and would indicate an internal error).
host
This echoes the input host you provided for the check. It's typically a domain name (e.g. "aws.amazon.com" in our sample) but could also be an IP address. The host tells you what was tested. NetDiag uses this to perform all the diagnostics (DNS lookup, pings, TLS handshake, HTTP request, etc.). If the host is malformed or non-existent, subsequent fields will show failures. For instance, if host is a typo domain, the dns results might show an error like NXDOMAIN (non-existent domain). Always double-check this field to ensure you're diagnosing the correct host. If issues appear, verifying that host is spelled correctly and points to the intended resource is the first troubleshooting step.
status
This is an overall status for the entire diagnostic run. It summarizes whether the diagnostics succeeded, partially succeeded, or failed. Common values include:
- Healthy — all requested checks completed successfully
- Warning — some checks returned non-critical issues like HTTP 4xx responses
- Unhealthy — critical failures like TLS errors or connection failures occurred
In our example, status is Healthy, indicating every probe in every region returned results without critical errors. This top-level status is useful for quickly gating logic in automation - e.g., if status is Unhealthy, you might alert an error without parsing individual fields.
Failure scenarios: A Warning status typically means one or more checks returned non-critical issues - perhaps an HTTP 403 response or a certificate approaching expiration. NetDiag is designed to gracefully degrade and return partial results if some probes fail. For example, if one of the three regional probes is unreachable or times out, the other two will still return their data and the overall status might reflect the worst condition with quorum indicating the fraction of regions that succeeded. An Unhealthy status indicates critical failures - TLS handshake failures, connection timeouts, or complete inability to reach the target.
Troubleshooting: When status is not Healthy, inspect the detailed results per region to find what failed. A warning could still provide valuable clues (e.g., perhaps only the Asia region had an HTTP 403, suggesting geo-blocking). The status field gives you a high-level red/yellow/green light, but the specifics live in the regions array.
quorum
Quorum indicates how many regions responded successfully out of the total requested. In distributed systems, quorum usually means "the minimum number of participants required to proceed," and here it's used similarly for diagnostic data. The quorum field is now an object with three properties:
"quorum": { "required": 2, "total": 3, "met": true }
required- The minimum number of healthy regions needed to consider the check successful (default: 2)total- The total number of regions that were checkedmet- A boolean indicating whether quorum was achieved
In our sample, quorum.total is 3 (US, EU, and Asia-Pacific probes), quorum.required is 2, and quorum.met is true meaning at least 2 out of 3 regions returned healthy results. NetDiag's coordinator will wait for all specified regions to report, but will return whatever it has after a timeout, hence you might see met: false with a partial status. Quorum matters because it tells you at a glance whether the diagnostic data is complete from all vantage points. A full quorum (met: true) means the picture is complete; met: false means some blind spots remain.
Failure scenarios: If quorum.met is false, it indicates one or more regions did not contribute data or returned unhealthy results. Common causes include a regional service outage or network partition preventing a probe from reporting. For example, if only 1 out of 3 regions succeeded and required is 2, then met would be false.
Troubleshooting: When you see quorum.met: false, consider issues like regional network blocks, downtime in that probe region, or extremely high latency causing a timeout. You might retry the check, possibly excluding the problematic region (NetDiag allows specifying regions via query param) to focus on the others while the issue is investigated. Generally, a quorum shortfall is a hint to investigate regional availability - it's telling you "we didn't get enough votes from all regions."
DNS Propagation Status (dnsPropagationStatus)
One of NetDiag's especially useful top-level indicators is dnsPropagationStatus. This field summarizes whether DNS results were consistent across all regions or not. In essence, it tells you if DNS propagation is complete or if there are mismatches among regions. In our example, dnsPropagationStatus is mismatched, indicating that probes resolved the target to different sets of IP addresses (expected for CDN-backed domains like AWS).
What it means and how it's produced
After each region performs its DNS lookup for the target, the coordinator compares the results. If every region saw identical DNS records (for example, each returned the same IP addresses), then dnsPropagationStatus is set to consistent. If there is any discrepancy - e.g., one region got a different IP address than the others, or one region failed to resolve while others succeeded - this field would flag a mismatch condition with mismatched.
Why it matters
DNS issues are infamously tricky ("It's always DNS!", as the joke goes). A propagation mismatch means not all users worldwide would reach the same server or any server at all. This often happens if a DNS change (like switching IPs for a domain) hasn't fully propagated to all DNS servers globally, or if a region is caching an outdated record. It can also happen by design - for instance, some CDNs return region-specific IPs, which technically is a "mismatch" but an expected one. NetDiag can't know your intent, so it will flag any difference. This heads-up is invaluable: it can confirm suspicions of DNS propagation delay or reveal an unintended inconsistency.
Typical values
In a healthy scenario with no geo-DNS, you'd expect dnsPropagationStatus to indicate uniform results (consistent). All regions returning the same A/AAAA records is the ideal case for simple setups. However, for CDN-backed sites, mismatched is normal and expected.
Real-world example showing expected mismatch (aws.amazon.com via CloudFront):
// ap-southeast resolves to Singapore CloudFront edge
"resolvedAddresses": ["108.156.144.30", "108.156.144.61", "108.156.144.27", "108.156.144.92"]

// eu-central resolves to Frankfurt CloudFront edge
"resolvedAddresses": ["13.32.121.54", "13.32.121.41", "13.32.121.53", "13.32.121.33"]

// us-west resolves to US CloudFront edge
"resolvedAddresses": ["3.163.24.96", "3.163.24.120", "3.163.24.15", "3.163.24.103"]
Each region gets different IPs because CloudFront routes users to the nearest edge location. The "mismatched" status is correct and expected here.
Real-world example showing consistent DNS (simple static site):
// All three regions resolve to the same IP
"dnsPropagationStatus": "consistent"
// ap-southeast: "resolvedAddresses": ["93.184.216.34"]
// eu-central: "resolvedAddresses": ["93.184.216.34"]
// us-west: "resolvedAddresses": ["93.184.216.34"]
Common failure scenarios and indications
-
Propagation delay: You updated a DNS record (say changed your website's IP), and soon after, NetDiag shows
dnsPropagationStatus: "mismatched". Likely some DNS servers (perhaps the one near the mismatching region) haven't updated yet. The region with the odd IP is probably showing the old value. This scenario indicates you should wait a bit longer (or flush DNS caches) - the TTL on the old record might not have expired yet. -
Geo-DNS or Anycast differences: If you're intentionally using a service that serves different IPs based on region (e.g., an anycast network or geo load balancing DNS), NetDiag will flag a mismatch. In this case, the "failure" is only nominal - it's expected. But it's still useful to see which IP each region got (in the
locations[*].dnsdetails) to verify your geo-DNS is working as intended. -
One region cannot resolve: If one probe reports, say, an NXDOMAIN or time-out while others resolve OK,
dnsPropagationStatuswill also note a mismatch. This could indicate a DNS server issue in that region or maybe an ephemeral lookup failure. It tells you the issue might not be global, but region-specific.
Troubleshooting tips
When you see a mismatch, drill down into the dns object for each location (discussed later) to identify the differing values. If it's a propagation delay, usually the fix is time - check the TTL of your DNS records and wait accordingly, or flush caches if possible. If it's a permanent mismatch (unexpected), ensure that your DNS records are consistent across your nameservers and that there isn't an outdated record lingering in a secondary DNS server. For geo-DNS setups, use dnsPropagationStatus as a sanity check, but interpret it with your knowledge of the expected behavior. In short, a mismatch tells you "not all users see the same thing" - use that clue to investigate DNS configuration or wait out propagation.
Timing Fields (startedAt and completedAt)
These two fields are timestamps marking the beginning and end of the diagnostic run:
startedAt- When the coordinator began processing the request.completedAt- When the coordinator finished assembling the results.
Both are typically in ISO 8601 UTC datetime format. In our sample, startedAt is "2026-01-01T04:03:58.3765584Z" and completedAt is "2026-01-01T04:03:59.6202816Z". This suggests the whole check took about 1.2 seconds from start to finish.
Why they matter
These timestamps let you measure how long the diagnostics took and can be useful for performance insights. A very long duration may indicate one of the checks was slow or retried. They also establish an order of events if you're logging multiple runs. For example, if you trigger NetDiag runs programmatically, you can use these to track if runs are overlapping or to compute the total elapsed time.
Typical values
Usually just a few seconds apart. NetDiag runs all regional probes in parallel, so the slowest check among all regions dictates the total time. In healthy conditions with near-instant DNS and no packet loss, a run might complete in 1-2 seconds. If tests involve higher latencies (say a ping to Asia from the US) or waiting for a DNS response, it could be a few seconds more. Our example of ~1.2 seconds is quite fast for a three-region check on a responsive site.
Common issues and what they indicate
-
Unusually long run times: If you see a much larger gap (e.g., 20-30 seconds or more), it means something lagged. Perhaps one region had to timeout on a ping or DNS query (common DNS timeout is around that range), or an HTTP request took a long time before responding. NetDiag will wait for each probe up to a certain timeout threshold before giving up (to still achieve quorum if possible). A long run suggests you check the individual timings in the
locationsdetails - you might find one region'shttp.responseTimeMsordnswas much higher than others, pointing to a slow server response or network issue. -
completedAtearlier than expected: This is less likely, but if the run completed almost instantly (say the timestamps are the same second), either everything was cached and super fast, or possibly the run short-circuited due to an immediate failure (e.g., if the target domain couldn't even be parsed, NetDiag might not even fan out checks). Always cross-reference thestatus- if you see a super quick completion but status is"Unhealthy", it could mean it failed fast (e.g., invalid input).
Troubleshooting tips
Use these timestamps as a rough performance measurement. If runs are consistently taking too long, identify which step is the bottleneck. For instance, if startedAt to completedAt is ~30 seconds and you find dnsPropagationStatus flagged a region's DNS failure, you might suspect a DNS query retry was happening (common DNS resolvers retry queries which can delay the response). Or if the HTTP check took long, maybe the server is slow or the request hung. Improving DNS TTLs, server response times, or removing unreachable regions (if one region is always slow from your vantage point) could help. Additionally, these fields can help in monitoring: if you notice NetDiag's own performance degrading (runs taking longer over time), it could hint at load issues or the need for tuning timeouts.
The regions Array: Multi-Region Diagnostics
The heart of NetDiag's response is the regions array. This is where you get the per-region breakdown of network diagnostics - each element in the array corresponds to a probe region that was used (e.g., US West, Europe, Asia Pacific). In our sample, we show entries for ap-southeast, eu-central, and us-west. Each region object contains the results of several types of checks performed from that region:
region- A human-friendly name or code for the region of the probe.status- Overall health status for this specific region.ping- ICMP ping results (latency, success, etc.).dns- DNS lookup results (records found, errors).tls- TLS handshake/certificate check results.http- HTTP request results.
Let's break down each of these nested sections and discuss what "healthy" vs "unhealthy" looks like for each, along with typical failure causes.
Before that, note how NetDiag's architecture enables this multi-region data: the coordinator sends out parallel requests to probes in each region. Each probe performs the ping, DNS, TLS, and HTTP checks nearly simultaneously. This design means the regions array gives you a snapshot of how things looked from different corners of the world at roughly the same moment. If one region's data is missing (as discussed in quorum), that region simply won't have an entry in the array or will have it with error info. Typically, for a full multi-region check you'll see three entries (for US, EU, and Asia by default) - each structured similarly. Now let's dive into the sub-objects:
Ping Check (regions[*].ping)
Ping measures basic network connectivity and latency. NetDiag's ping result is essentially an ICMP echo request to the target host from the given region. In our sample for ap-southeast, the ping object is:
{
  "status": "Healthy",
  "avgRttMs": 1,
  "minRttMs": 1,
  "maxRttMs": 1,
  "packetLossPercent": 0,
  "message": "1.0ms",
  "error": null,
  "tcpFallbackUsed": false
}
What it means and how it's produced
A probe sends a small ICMP packet to the target (using the target's IP). If a response comes back, it records the round-trip time in milliseconds (avgRttMs). If no response comes (within a timeout), it may mark an error and possibly try a fallback method. The tcpFallbackUsed field indicates how the latency was measured - false means a standard ICMP ping worked. NetDiag uses an alternate method if ICMP fails; for example, it attempts a TCP handshake (e.g., opening a TCP socket to port 443) to estimate latency if pure ICMP is blocked. In such a case, tcpFallbackUsed would be true to denote the fallback was used, and the message would include "(TCP)".
Why it matters for diagnostics
Ping is your basic reachability test. A low latency and status: "Healthy" suggests the network path is fine. High latency or packet loss (failure) indicates potential network issues between that region and your target. Because NetDiag does this globally, you might find that one region has significantly higher latency or timeouts while others are fine, pointing to a routing issue or regional connectivity problem. Ping can also reveal if the host is completely down (no region can ping it means likely offline or blocking ping).
Typical values (healthy)
For healthy sites, status will be "Healthy", and avgRttMs will be some tens of milliseconds, varying by region distance. In our sample, ap-southeast to aws.amazon.com was ~1 ms (very fast, likely hitting a nearby CDN edge). European and US probes show similar low latencies when the target uses a CDN. If the target is very close to the region or using a CDN node in-region, latencies could be single-digit ms. The key is that avgRttMs is non-null and reasonably within expected range for that geography.
Real-world examples
{
  "status": "Healthy",
  "avgRttMs": 1,
  "message": "1.0ms",
  "tcpFallbackUsed": false
}
Fast ICMP response (1ms) - likely hitting a nearby CDN edge
{
  "status": "Healthy",
  "avgRttMs": 202.11,
  "minRttMs": 201.85,
  "maxRttMs": 202.58,
  "message": "202.1ms (TCP)",
  "tcpFallbackUsed": true
}
ICMP blocked, but TCP handshake succeeded - still healthy
{
  "status": "Healthy",
  "avgRttMs": 294.21,
  "message": "294.2ms (TCP)",
  "tcpFallbackUsed": true
}
Higher latency from Asia to US server - expected for cross-region
Common failure scenarios
-
ICMP blocked / no response: Many servers (or networks) block ICMP ping. In this case, the initial ping attempt will timeout. NetDiag doesn't give up here - it tries the TCP fallback. If you see
"tcpFallbackUsed": trueand a latency value, that indicates ICMP was unresponsive and it measured latency by doing a TCP SYN handshake. The presence of the fallback means the host was actually reachable (since a TCP response was obtained), just not via ping. So status might still be"Healthy"(because connectivity was confirmed via TCP) even though ICMP failed. If both ICMP and TCP fail, then status would be"Unhealthy"and no latency recorded. -
High latency or packet loss: If the
avgRttMsis very high or fluctuates across runs, it could indicate network congestion or an inefficient route. NetDiag reports the average latency along withminRttMsandmaxRttMsto show variance. A highpacketLossPercentwould indicate unreliable connectivity. -
Regional outage: If one region's ping fails while others succeed, it might not be your server's fault at all - it could be that region's network can't reach the destination (e.g., transpacific link issues, routing problems, or that region being firewalled by the target). This scenario shows up as one location with
status: "Unhealthy"(or missing ping data entirely) while others have normal latency. -
Target down: If all regions report ping failures, and especially if other checks (HTTP, etc.) also fail, it's a strong sign the target host is down or unreachable globally. Ping gives the first hint of that.
Troubleshooting tips
For ping issues, context is key. If one region has a problem, investigate networking from that region - maybe use traceroute from that region (if available) or check if the target is blocking that region's IP range. If ICMP is blocked but TCP is working (tcpFallbackUsed: true), you might simply note that some monitoring tools treat that as "ping not supported" - not an error with the site per se. NetDiag smartly falls back to TCP so you still get latency info, but you should be aware that the actual ICMP didn't get through. If latency is high, consider CDN or edge caching for that region, or it could be normal given distance - compare with expected values or previous runs. For persistent ping failures, look at the http results next: if HTTP is successful despite ping failing, the issue is likely just ICMP being blocked (and not a show-stopper). However, if both ping and HTTP fail from a region, treat it as a serious connectivity problem to debug (DNS and TLS results can further narrow down where it fails).
DNS Check (regions[*].dns)
The dns object contains the results of DNS resolution from that region. This typically includes the resolved IP addresses (both IPv4 and IPv6). In our sample, the ap-southeast DNS section looked like:
{
  "status": "Healthy",
  "resolvedAddresses": [
    "108.156.144.30",
    "108.156.144.61",
    "108.156.144.27",
    "108.156.144.92",
    "2600:9000:2755:fe00:1c:a813:8500:93a1",
    "2600:9000:2755:3400:1c:a813:8500:93a1"
  ],
  "message": "Resolved to 108.156.144.30, 108.156.144.61, ...",
  "error": null
}
What it means and how it's produced
The probe performs DNS lookups for the target domain. It queries a recursive resolver for A (IPv4) and AAAA (IPv6) records. The results are lists of addresses found in resolvedAddresses. In the example, it found multiple A records and AAAA records for aws.amazon.com - typical for a CloudFront-backed domain with multiple edge IPs. The error field is null, indicating the DNS query was successful. If the DNS lookup itself failed (e.g., domain not found or query timed out), we would see an error message there instead.
Why it matters
DNS is the first link in the chain of connecting to a host. If DNS fails, everything else (ping, TLS, HTTP) will likely fail because the probe cannot even find an IP to contact. By checking DNS from multiple regions, you can detect issues like propagation delays, misconfigured DNS records, or regional DNS server problems. The presence of expected records tells you if the domain is configured correctly. It also provides the IP addresses that each region is resolving to, which is crucial if you suspect geolocation-based responses or anycast. NetDiag basically double-checks that the name resolution is correct before proceeding with other checks, and it shares that info with you.
Typical values (healthy)
For a working domain, you should see at least one address in each region's dns result. The error field will be null if resolution succeeded. The address lists should generally match across regions (and dnsPropagationStatus at top will be "consistent" if so) - unless using geo-DNS where differences are expected. In our AWS example, all regions list multiple IPv4 and IPv6 addresses, but they differ by region due to CloudFront's geo-routing.
Real-world examples
{
  "status": "Healthy",
  "resolvedAddresses": [
    "108.156.144.30",
    "108.156.144.61",
    "108.156.144.27",
    "108.156.144.92"
  ],
  "message": "Resolved to 108.156.144.30, ...",
  "error": null
}
CDN-backed site (aws.amazon.com) - multiple edge IPs returned
{
  "status": "Healthy",
  "resolvedAddresses": ["93.184.216.34"],
  "message": "Resolved to 93.184.216.34",
  "error": null
}
Simple hosted site with a single IP address
{
  "status": "Healthy",
  "resolvedAddresses": [
    "104.21.58.171",
    "172.67.162.78",
    "2606:4700:3035::ac43:a24e",
    "2606:4700:3034::6815:3aab"
  ],
  "error": null
}
Site behind Cloudflare with both IPv4 and IPv6 addresses
Common failure scenarios
-
NXDOMAIN (Domain not found): If the domain doesn't exist or is spelled incorrectly,
dns.errorwill likely contain something like "domain not found", andresolvedAddresseswill be empty. All regions would report the same, anddnsPropagationStatuswould likely be"consistent"(they all agree nothing exists!). This clearly indicates a typo or an actually unregistered domain. -
Timeout or ServFail: Sometimes DNS servers don't answer in time or return a server failure. If one region hits a slow or flaky resolver, you might get a
dns.error: "Timeout"in that region's entry, whereas others succeeded. This would create a mismatch. It indicates a temporary DNS issue or a problem with that region's DNS infrastructure. -
Partial records: Suppose a domain has both A and AAAA, but one of those record types isn't configured correctly. You might see addresses come through but with some missing record types. These cases are rarer, but they indicate misconfigurations in DNS records (like a broken DNSSEC or a bad delegation for a specific record type).
-
GeoDNS differences: As discussed, if a DNS service intentionally gives different answers by region (common with CDNs), one region's addresses might differ from another's. NetDiag doesn't consider intent, so it flags it as mismatch. The
dnssection will clearly show the differing IPs. This isn't exactly a "failure", but it's a scenario to be aware of. It matters because if one of those IPs is wrong or down, only that region's users suffer. NetDiag helps catch that.
Troubleshooting tips
If DNS fails across all regions, focus on the domain itself: check if it's correct, and use public DNS tools to see if the name is resolvable. Often the cause is a configuration error (e.g., you forgot to add a DNS record, or the domain expired). If only one region fails or sees a different result, consider propagation delay or regional DNS caching. In case of propagation delays, usually time will resolve it - you can verify by checking the TTL of the record (NetDiag doesn't directly show TTL, but knowing when you made a change and what the default TTL is can hint at how long until consistency). If it's an unexpected difference, double-check your DNS provider's geo-DNS settings or whether that region might be querying a DNS server with stale data. You could rerun the check after some time to see if it resolves to the expected value (propagation progress). In summary, treat the DNS section as the foundation - if something is off here, fix it before chasing ping or HTTP issues, because they might just be consequences of DNS not pointing to the right place.
TLS Check (regions[*].tls)
TLS diagnostics focus on the security of the connection - validating the SSL/TLS certificate for the target. NetDiag's TLS check will attempt to perform an SSL handshake with the target (usually on port 443) and then report on certificate validity and details. From our sample:
{
  "status": "Healthy",
  "certificateValid": true,
  "daysUntilExpiry": 289,
  "expiresAt": "2026-10-17T23:59:59+00:00",
  "subject": "aws.amazon.com",
  "issuer": "Amazon RSA 2048 M04",
  "protocol": "Tls13",
  "message": "Valid for 289 days (Amazon RSA 2048 M04)",
  "error": null
}
What it means and how it's produced
Each probe opens a TLS connection to the target (e.g., aws.amazon.com:443) and inspects the certificate chain presented. The certificateValid flag tells whether the certificate is considered valid and not expired as of now (the probe checks common things: date validity, hostnames matching, and that the chain is trusted by system CAs). The expiresAt is the certificate expiration date, and daysUntilExpiry calculates how many days remain. The issuer is the certificate authority that issued the cert. The protocol field shows which TLS version was negotiated (here "Tls13").
Why it matters
An HTTPS site is only as good as its certificate. An invalid or expired TLS cert will break secure connections for users. By checking this via NetDiag, you can catch certificate problems from multiple vantage points. Usually certificate issues will appear the same globally (since it's the same cert), but this check ensures each region can establish a secure TLS connection. It's possible for there to be differences if, say, your CDN terminates SSL in each region with possibly different certificates, but that's uncommon unless intentionally configured. Typically, a failing TLS check (e.g., certificateValid: false) means any user would also have trouble (browser warnings or outright inability to connect). TLS checks also reveal how soon a cert will expire, which is great for proactively renewing it - e.g., if daysUntilExpiry is low, you should plan to update the cert.
Typical values (healthy)
You should see certificateValid: true for a properly configured HTTPS site. The issuer will be a known CA (DigiCert, Let's Encrypt, Amazon, etc.), and expiresAt a date in the future. Many certificates expire 3 months to a year out. If using Let's Encrypt, expect roughly 3-month renewal cycles. If using a long-lived cert, maybe up to a year or more. If everything's good, all regions should show the same expiresAt and issuer (since it's the same cert they all get during the handshake).
Real-world examples
{
  "status": "Healthy",
  "certificateValid": true,
  "daysUntilExpiry": 289,
  "expiresAt": "2026-10-17T23:59:59+00:00",
  "subject": "aws.amazon.com",
  "issuer": "Amazon RSA 2048 M04",
  "protocol": "Tls13",
  "message": "Valid for 289 days (Amazon RSA 2048 M04)"
}
Valid certificate with TLS 1.3 - the ideal scenario
{
  "status": "Unhealthy",
  "certificateValid": false,
  "daysUntilExpiry": -3916,
  "expiresAt": "2015-04-12T23:59:59+00:00",
  "subject": "*.badssl.com",
  "issuer": "COMODO RSA Domain Validation Secure Server CA",
  "protocol": "Tls12",
  "message": "Expired 3916 days ago"
}
Expired certificate - note the negative daysUntilExpiry
{
  "status": "Unhealthy",
  "certificateValid": false,
  "daysUntilExpiry": null,
  "expiresAt": null,
  "subject": null,
  "issuer": null,
  "protocol": null,
  "message": "TLS connection to 192.0.2.1:443 failed",
  "error": {
    "code": "TlsConnectionFailed",
    "message": "TLS connection to 192.0.2.1:443 failed",
    "details": "Unable to establish secure connection"
  }
}
TLS handshake failed - server not accepting secure connections
Common failure scenarios
-
Certificate expired: This is one of the most common issues. If the cert's date is past current time,
certificateValidwill befalse. NetDiag still lists the expired date and issuer. A typical sign iscertificateValid: falseanddaysUntilExpiryshowing a negative number. All regions would reflect this because it's a property of the cert itself. -
Hostname mismatch: If the target hostname doesn't match the certificate's Subject or SAN, the TLS check will fail validation. For example, you ran NetDiag on
example.combut the certificate is forwww.example.com- that mismatch causescertificateValid = false. This could happen if you accidentally used the wrong domain or if the site isn't configured for the bare domain vs. www. -
Untrusted issuer: If the certificate is self-signed or from an untrusted CA, NetDiag will flag it invalid. The issuer might be something like "MyCompany CA" which is not in public trust stores. This usually indicates a configuration issue (using a private certificate on a public site) or some MITM proxy scenario.
-
Incomplete chain: If the server didn't provide intermediate certificates, some clients consider the cert untrusted. NetDiag's
tlscheck likely would mark that as invalid as well, since the chain could not be verified. The error might not be explicitly shown, butcertificateValidwould befalseeven though the cert isn't expired and the names match. -
TLS connection failed: The server might not be accepting TLS connections at all. In this case, you'll see
error.code: "TlsConnectionFailed"with null values for certificate details. This indicates the server isn't responding on port 443 or is rejecting the TLS handshake entirely. -
Timeout: The TLS handshake might fail due to the server not responding in time. You'll see
error.code: "Timeout". This could indicate firewall blocking, server overload, or network issues.
Troubleshooting tips
If certificateValid is false, immediately check expiresAt. If it's past, you need to renew your certificate - that's a straightforward fix. If the date is fine, look at the domain: does it exactly match the cert's domain (including subdomain)? If not, update your certificate to include the correct host (or use the correct host in the target). For issuer or trust issues, make sure you're using a standard CA for public sites. If it's an internal service using a self-signed cert, you know why it's untrusted (and NetDiag just confirms it). For chain issues, configure the server to send the full certificate chain. Tools like SSL Labs or even openssl s_client can help diagnose the exact cause if NetDiag only gives a broad "invalid" flag. The key is NetDiag has alerted you that something is off in TLS - given the critical nature of TLS for security, treat any non-true certificateValid as high priority. Also, note the daysUntilExpiry even when valid: if it's approaching expiration, schedule that renewal to avoid future downtime. This early warning can save you from the scramble of an expired cert outage.
HTTP Check (regions[*].http)
Finally, the http object contains the results of an actual HTTP(S) request to the target. This is the end-to-end test, verifying that the web server responds and what it responds with. In our sample (ap-southeast):
{
  "status": "Healthy",
  "statusCode": 200,
  "reasonPhrase": "",
  "totalTimeMs": 325,
  "message": "200  in 325ms",
  "error": null
}
What it means and how it's produced
After DNS, ping, and TLS (if applicable) are done, the probe issues an HTTP GET request to the target. By default, NetDiag will use HTTPS (because it already did the TLS handshake) - typically it requests https://<host>/ (the root path). The fields captured include the HTTP status code (200 in our example, meaning OK), the time taken for the HTTP request (totalTimeMs - 325 ms here), and the reasonPhrase from the response. The error field captures any connection-level errors.
Why it matters
This is the ultimate integration test - even if DNS, ping, and TLS are all fine, the web server might still return an error (for example, the site could be up but responding with 500 Internal Server Error due to an application bug). The HTTP check verifies the actual web service. By doing it from multiple regions, you can catch issues like one region being served a different content or an error page due to, say, a misconfigured CDN or load balancer routing. Also, if the site uses geolocation, you might see different redirect patterns (maybe redirect to regional sites) or different status codes by region (though ideally not). The HTTP status code is a quick indicator of what a user's browser would get. A 200 means success. A 301/302 would indicate a redirect. A 4xx means client error (maybe the page doesn't exist or access is forbidden). A 5xx means server error.
Typical values (healthy)
For a well-functioning website, expect a statusCode in the 200-299 range. 200 is most common (OK). The totalTimeMs in a healthy case should be reasonably low - in our sample ~325 ms for a full page response. Realistically, 100-500 ms is normal for a simple page, and up to a few seconds for something heavy or if network latency is high. Each region will have its own response time depending on distance and server speed.
Real-world examples
{
  "status": "Healthy",
  "statusCode": 200,
  "reasonPhrase": "OK",
  "totalTimeMs": 325,
  "message": "200 OK in 325ms",
  "error": null
}
Successful HTTP response - the ideal scenario
{
  "status": "Warning",
  "statusCode": 403,
  "reasonPhrase": "Forbidden",
  "totalTimeMs": 1032,
  "message": "403 Forbidden in 1032ms",
  "error": null
}
Access denied - could indicate geo-blocking or auth required
{
  "status": "Unhealthy",
  "statusCode": null,
  "totalTimeMs": null,
  "message": "HTTPS request to 198.51.100.1:443 timed out",
  "error": {
    "code": "HttpTimeout",
    "message": "HTTPS request to 198.51.100.1:443 timed out",
    "details": "Server not responding or blocked at network level"
  }
}
Server unresponsive - possible network or firewall issue
Common failure scenarios
-
HTTP 5xx errors: If the server is up but encountering errors processing the request, you might get status 500 (Internal Server Error), 502/503 (bad gateway or service unavailable, often from proxies or load balancers). A 5xx indicates the server itself had an issue - could be an application crash, overload, or misconfiguration. If this happens in one region and not others, it could be that a specific server (in a multi-server setup) or database in that region is having issues.
-
HTTP 4xx errors: A common one is 404 Not Found, which might occur if the target path is wrong. NetDiag requests the root "/", which usually exists. Another 4xx could be 403 Forbidden if, say, the site blocks certain regions or requires authentication. For instance, some sites geo-block traffic; in that case, a particular region's HTTP might return 403 while others return 200 - NetDiag would reveal that discrepancy.
-
Connection timeouts / no response: If the HTTP request cannot be made at all (e.g., the TCP connection to the server failed or hung, or TLS failed - which would likely be caught in TLS step), you'll see an error instead of a status code. The output might show an error message like
"HttpConnectionFailed"or"HttpTimeout". Essentially, no HTTP data means the web server didn't respond. This could be caused by the service being down or a firewall blocking that region. -
Redirect loops or multiple redirects: If a site misconfigures redirects, you might not get a final 200. For example, region A might redirect to a URL that redirects back or fails. NetDiag likely has a redirect limit. If exceeded, it could report an error. Either way, an unexpected redirect status might surface.
-
Different content by region (CDN logic): If, say, users from EU are redirected to an EU-specific site (like example.eu), the EU probe might get a 302 to a different domain. This is not a "failure" but something to be aware of. It pairs with the DNS geo stuff we talked about - some setups do it via DNS, some via application redirect. NetDiag will faithfully show what each region got.
Troubleshooting tips
HTTP issues often require looking at your server logs or configuration:
-
For 5xx errors, check your server or application logs around the time of the test. If only one region got a 5xx, it might be a specific server node or data center problem. For example, maybe your EU cluster is down. NetDiag just provided evidence: EU got 502 while US and APAC got 200. That tells you to focus on EU servers or connections.
-
For 4xx errors, consider if the URL is correct and accessible. If 403 in one region, perhaps that region's IP is blocked (either by your firewall or by a WAF/CDN security rule). If 404, maybe a missing page or misrouting in one region. For instance, a CDN might not have the content in that region if it wasn't deployed correctly.
-
If timeout or no response, treat it like the service is down in that region. Could be a network path issue - combine with ping results: if ping also failed for that region, likely a connectivity issue. If ping succeeded but HTTP timed out, it might be the service on port 80/443 is not listening or a firewall is blocking that port from that region. Ensure your server isn't blocking those IP ranges.
-
Redirect issues: If you see unexpected redirects, verify your server's redirect configuration. Maybe you intended to redirect http->https but NetDiag was already using https, so there should be none (if you still see one, maybe from www to non-www or vice versa). Ensure there isn't a misconfiguration causing a redirect loop.
-
Generally, the HTTP status code is your quickest clue. Anything in the 200s is usually okay, but 4xx and 5xx are red flags. Use the status codes in each region to pinpoint where the problem lies geographically or in your infrastructure chain.
A Note on NetDiag's Architecture and Multi-Region Operation
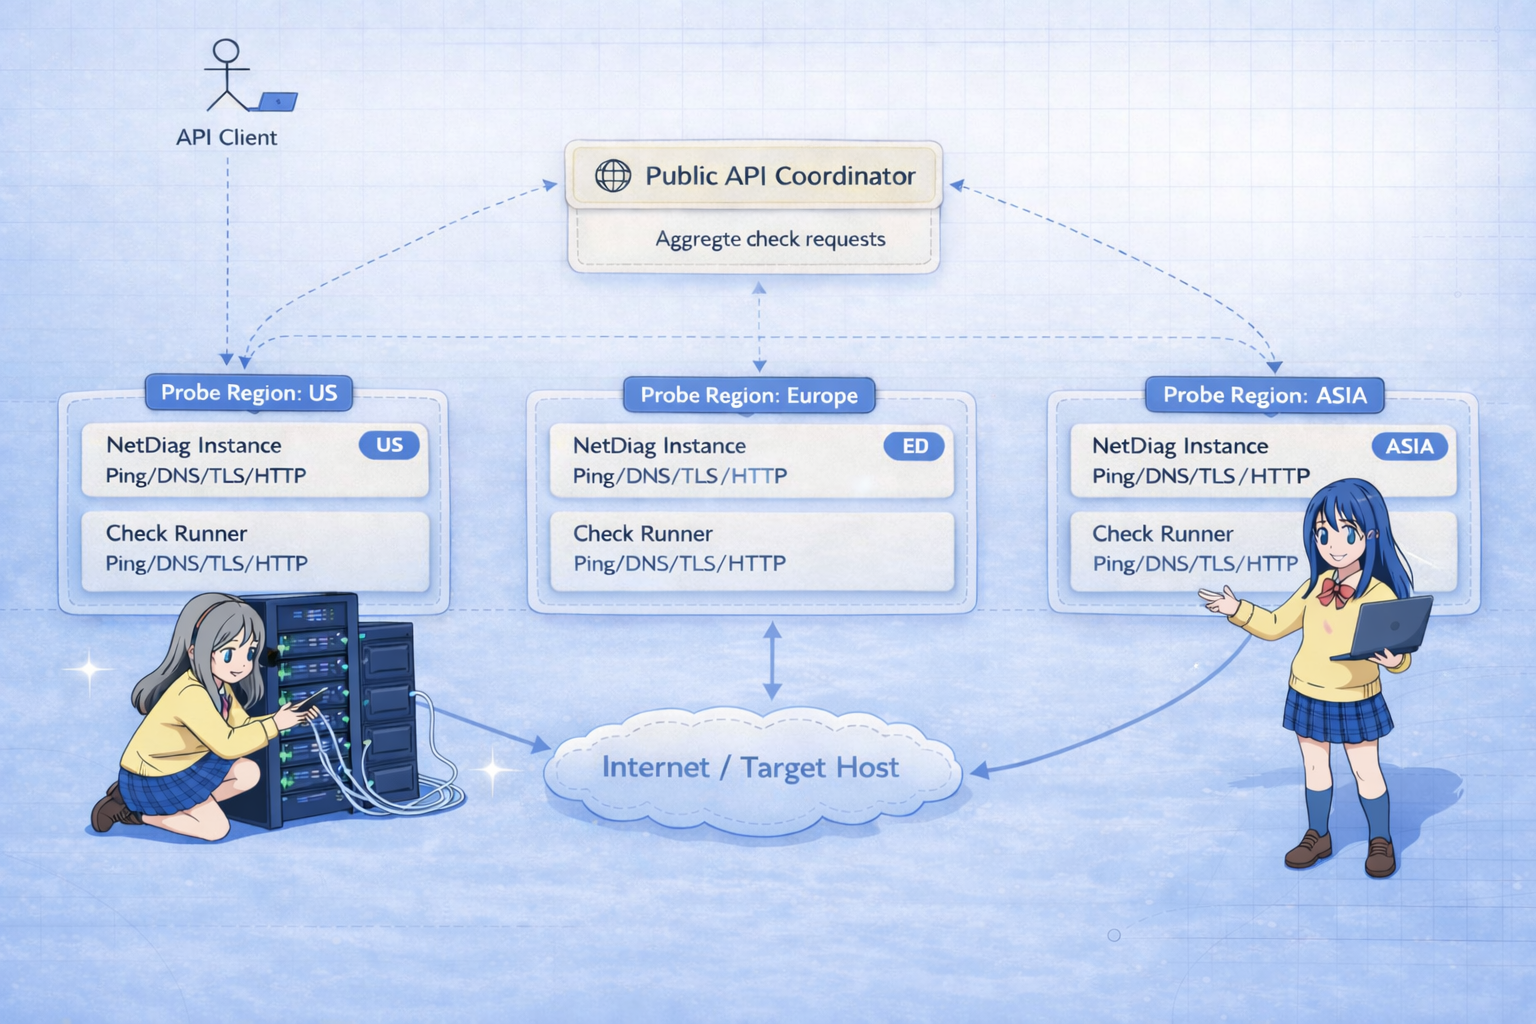
It's worth summarizing how NetDiag is pulling all this off, because understanding that can help interpret the results. NetDiag uses a coordinator-and-probes model. When you hit the public API (the coordinator), it in turn fans out requests to probe servers in multiple regions (currently US, Europe, Asia by default). Each probe does the checks (ping, DNS, TLS, HTTP) in parallel and returns its findings. The coordinator then aggregates those into the JSON response we explored. This all happens concurrently, so a slow region won't hold up the others (except overall completion time waiting for it). If a probe fails to respond or is unreachable, NetDiag will still return what it got from others - that's the graceful degradation mentioned earlier.
The reason multiple regions are involved is to give you a distributed perspective: the internet can behave very differently depending on where you're standing. By having (for example) a probe in Oregon, another in Germany, and another in Singapore, NetDiag provides a quick sanity check across the globe. It helps answer questions like, "Is this problem global or regional? Is DNS updated everywhere? Is my site up in Europe? Are users in Asia seeing higher latency or errors?" without you having to manually test from those places.
Architecturally, each NetDiag instance can act as both a coordinator and a probe, and they smartly detect if a region is their own - in which case they run the checks locally without an extra network hop. All probes execute in parallel, so the slowest one dictates the completedAt time. This design also implies that the regions array is effectively unordered or in arbitrary order (though often consistent). You should not assume, for example, the first entry is always US - it might be, but it's not guaranteed; always check the region field to know which is which.
Understanding this architecture lets you trust that when you see a missing region or a partial quorum, it's not because NetDiag skipped it arbitrarily - it's because something went wrong specific to that region's probe or the path to the target. And conversely, when all regions report success, you can be fairly confident the issue (if any) is not location-specific.
NetDiag is like having a team of troubleshooters around the world, all running tests at the same time and reporting back. As a developer, this saves you the hassle of spinning up VMs in different regions or waiting for users from across the world to report problems. And the schema we just went through is how you receive their collective report.
Conclusion
In summary, the NetDiag response schema is designed to be comprehensive yet structured logically for quick scanning:
- Top-level fields give you the who/what/when of the run (
runId,host, timestamps) and a high-level pass/fail overview (status,quorum). - DNS propagation status flags any inconsistency in one of the most failure-prone aspects of networking, so you can zero in on DNS if needed.
- Per-region data (
regions) then provides the nitty-gritty: was the site reachable (ping), resolvable (DNS), secure (TLS), and serving content (HTTP) from each vantage point.
For each diagnostic category, we discussed what a healthy outcome looks like versus an unhealthy one. To recap a few key troubleshooting insights:
-
Ping: If latency is missing or high, consider ICMP blocks or network issues; NetDiag's TCP fallback ensures you still get data where possible, so use the
tcpFallbackUsedclue. Compare regions to distinguish local network issues from target-side issues. -
DNS: If
dnsPropagationStatusis"mismatched", don't panic but do investigate - it often explains a lot of "it works here but not there" scenarios. Ensure DNS records are properly configured and just be patient if you recently made changes. -
TLS: A
certificateValid: falseis an actionable alert - check expiry and hostname immediately. Certificates can bring a site down for users, so this early warning is gold. Use it to avoid or quickly fix cert incidents (expired cert is a very common production oops - now hopefully a thing of the past for you). -
HTTP: Status codes are your friends. Anything not in 200s deserves attention. NetDiag gives you essentially what a user's browser would see (sans content). If one region sees a 500 or 403 and others don't, you've pinpointed where to look in your infrastructure. And if all regions show a failure, your site is likely down or misconfigured globally.
Armed with this knowledge of the schema, you can leverage NetDiag more effectively. Instead of treating it as a black box, you now know that quorum drops when a region is unreachable, that a dnsPropagationStatus: "mismatched" likely underlies that weird report from Europe, or that tls.certificateValid flipping to false is your cue to renew a cert before it bites you. Think of each field as a piece of a puzzle - when all the pieces are green and consistent, you have a clean bill of health; when one is red or out of place, you have a clue to solve the outage mystery.
In real-world debugging, such clues are invaluable. NetDiag essentially packages a multi-tool for network diagnostics into a single JSON response. By understanding its schema, you can quickly interpret the results and turn data into action - whether that's fixing your DNS settings, optimizing network paths, renewing certificates, or scaling your server capacity. Happy debugging, and may your future outages be short and swiftly resolved with the help of tools like NetDiag!